Trading · Indicator
Weinstein Stage Matrix
A TradingView indicator that sorts any chart into Stan Weinstein’s four stages — basing, advancing, topping, declining — anchored on the weekly timeframe.
Source is private
Synthetic data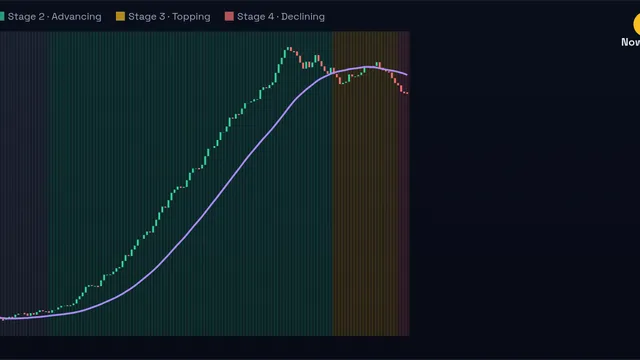
What it is
Stage analysis reads where a chart sits in its cycle — basing, advancing, topping or declining. This indicator makes that stage explicit on any chart instead of leaving it to eyeballing.
The repository (named Playground on GitHub) holds a clean and a verified/refined version of the script.
What I built
- A weekly-first stage engine on the 30-period moving average, inspectable on 2-week and monthly bars while you look at a daily chart.
- Explicit heuristics for the fuzzy transition stages (1 and 3): a flattening MA, proximity to the MA and the prior trend.
- Higher-timeframe requests on confirmed bars only, to reduce repainting.
- A weekly close-verification layer that can overrule a lazy MA-only reading when support/resistance and candle structure clearly disagree.
- Sensitivity profiles (conservative, balanced, aggressive) with anti-whipsaw stability, channels and yearly high/low markers.
- Alerts for Stage 1, Stage 2 breakout, Stage 3 and Stage 4 breakdown.
About the demo. The source is private, so this page describes the project at a high level. The visual above runs on invented sample data generated in your browser — nothing on this page comes from a real account, device, network or portfolio.